
Paylytics®
Card activity analytics built from your processing data.
What Paylytics shows
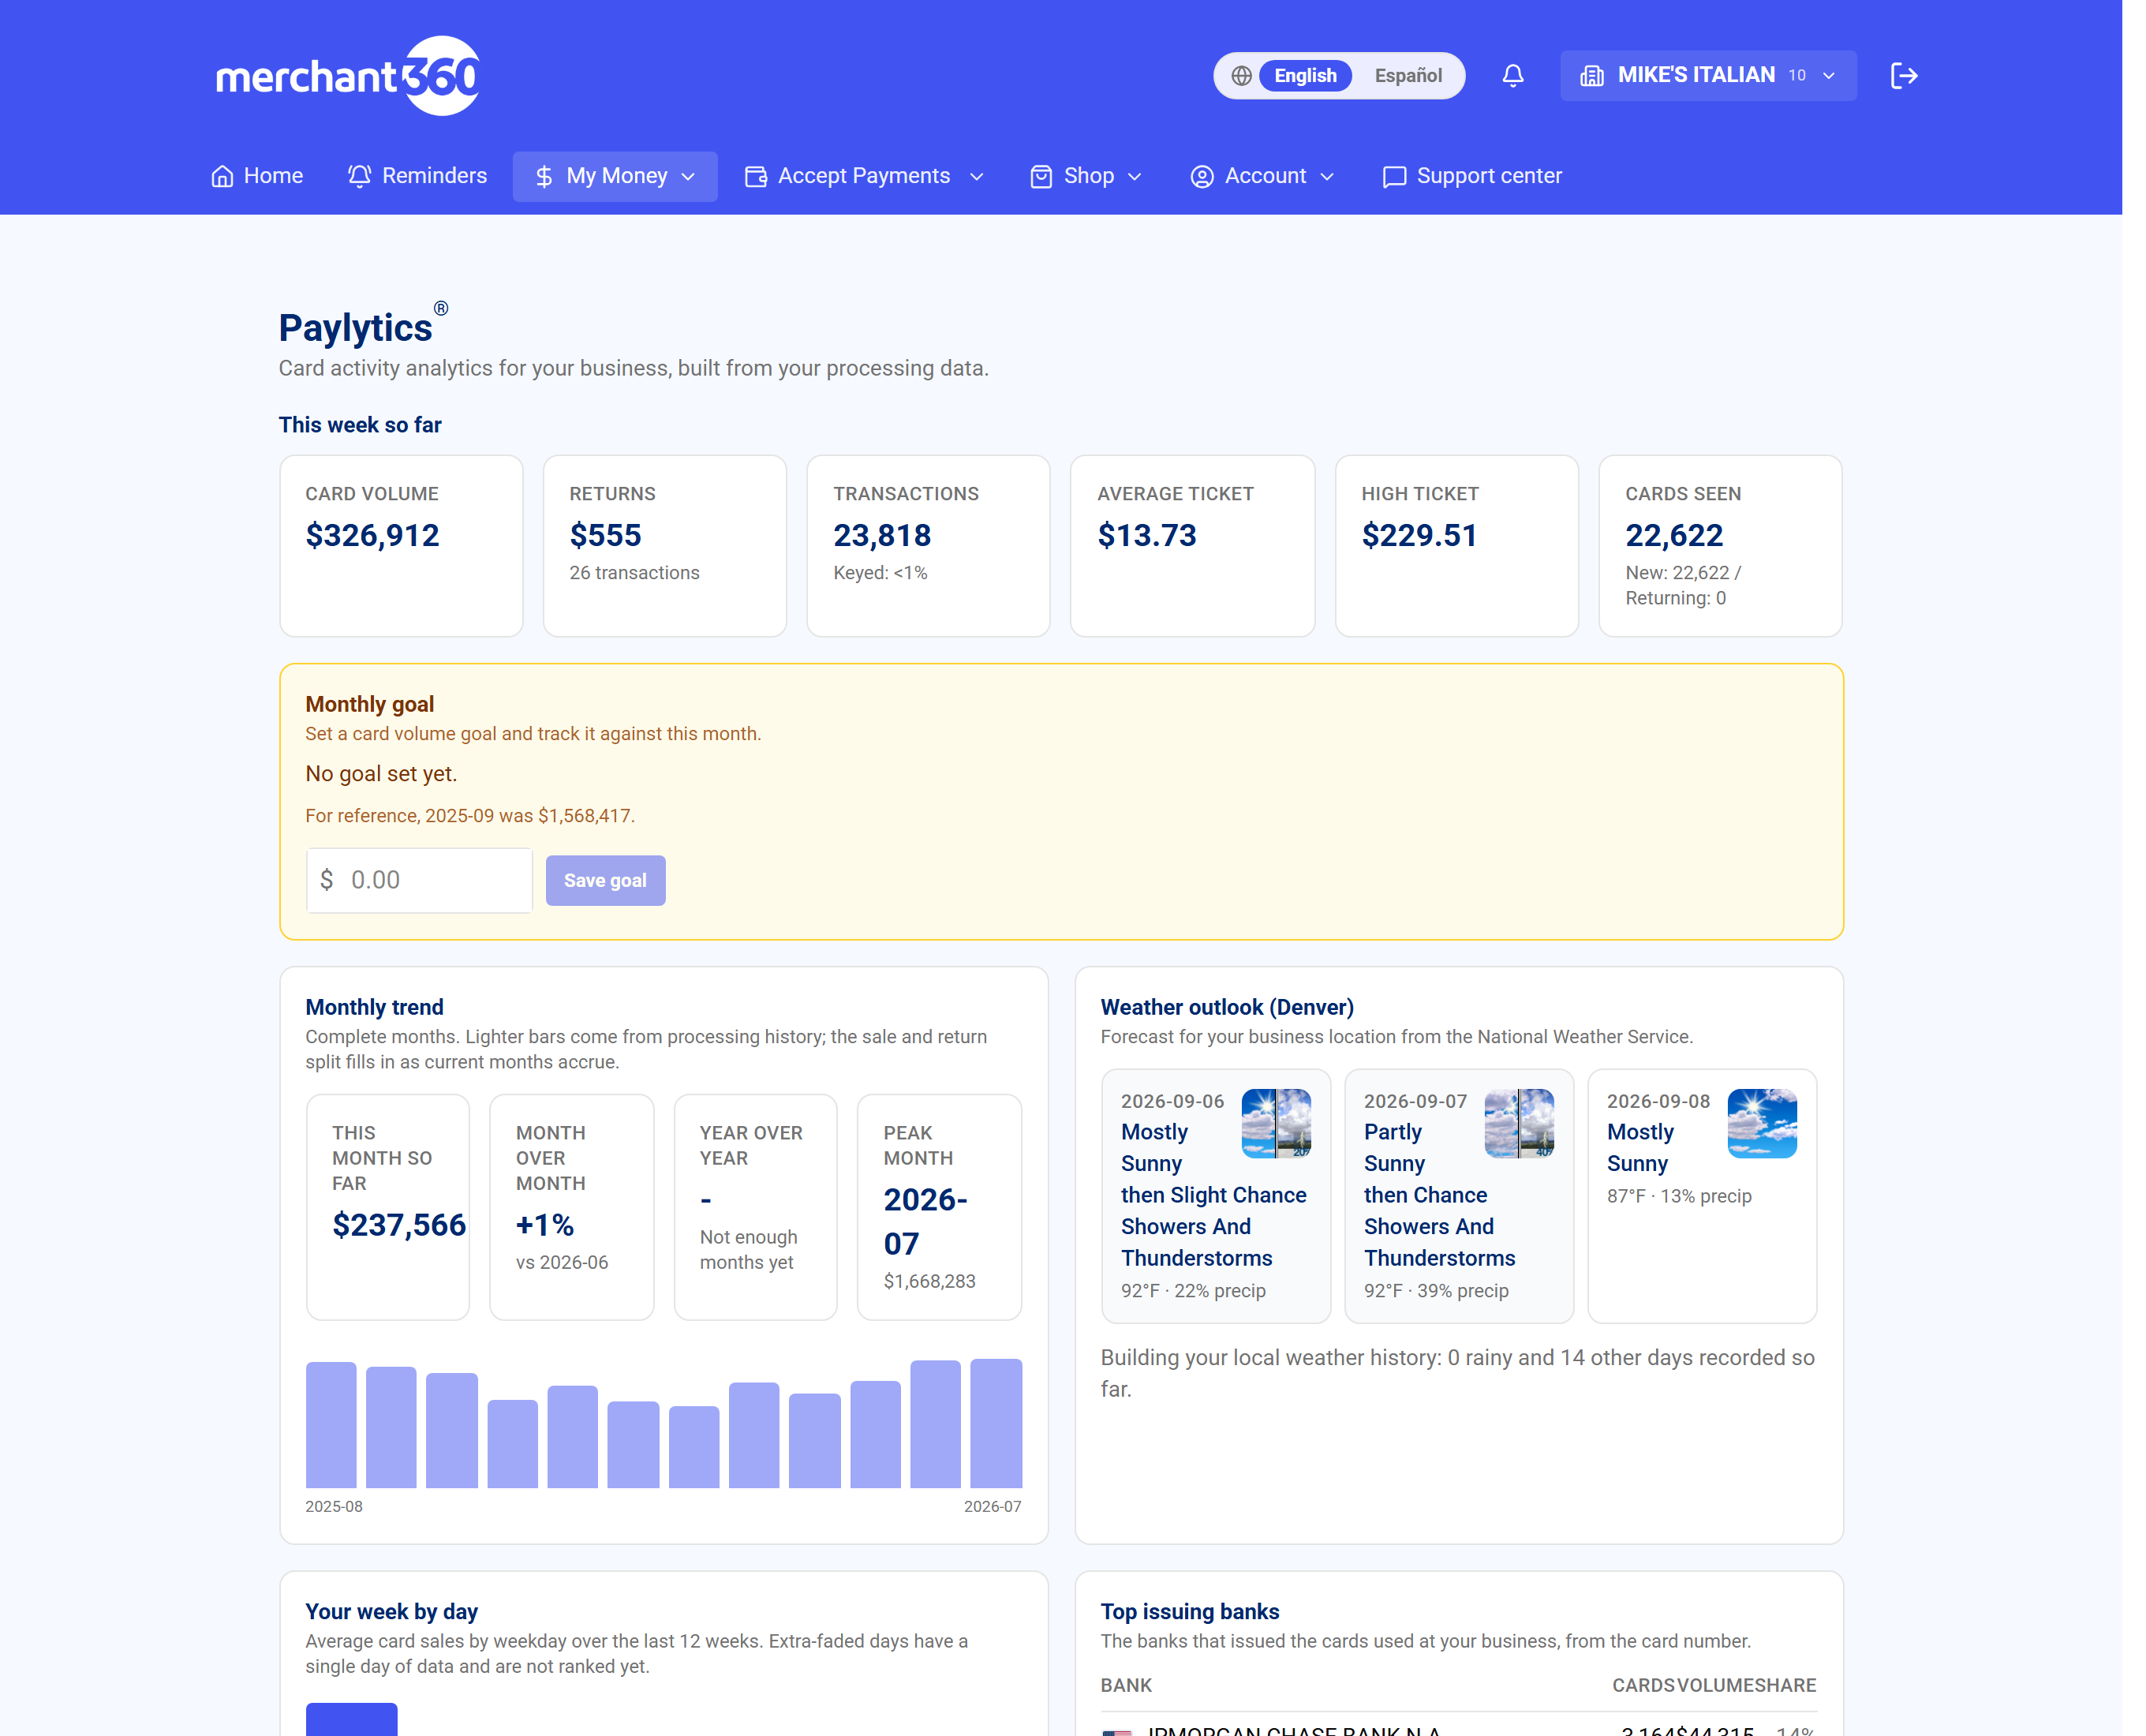
Paylytics is the analytics page for your card business. It reads your settled card transactions and turns them into weekly and monthly views: how much you took, how many customers came, how big the average ticket was, and how those numbers compare with your own past weeks and with businesses like yours.
The top row is This week so far: Card volume, Transactions, Average ticket, High ticket, Returns, Keyed, and Cards seen, each with the change against the same days last week. Below it, Weekly volume charts the last several months so you can see the trend.
Open it on Monday morning to review last week, and before you set staffing or ordering for the week ahead. Every number is built from cards, so cash sales are not included, and figures fill in as batches settle, usually the next business day.
If the page shows no data, your account has not settled a card batch yet, or the analytics has not run since your first batch. It updates daily. If a number looks low for today, the day's batch has not settled yet.
| On this screen | What it does |
|---|---|
| This week so far | Card volume, Transactions, Average ticket, High ticket, Returns, Keyed, and Cards seen for the current week, each with the change versus the same days last week. |
| Weekly volume | Bar chart of card volume by week over recent months. |
| Card volume | Total settled card sales for the period. |
| Returns | Total refunded to cards for the period. |
| Keyed | Volume taken by typing the card rather than tapping or inserting it. |
| Cards seen | How many distinct cards paid you in the period. |
New and returning customers
Paylytics recognises a card when it comes back, so it can tell you how many of the week's customers were new and how many had paid you before. The New / Returning card shows both counts, and New customers by week charts how many first-time cards you saw each week.
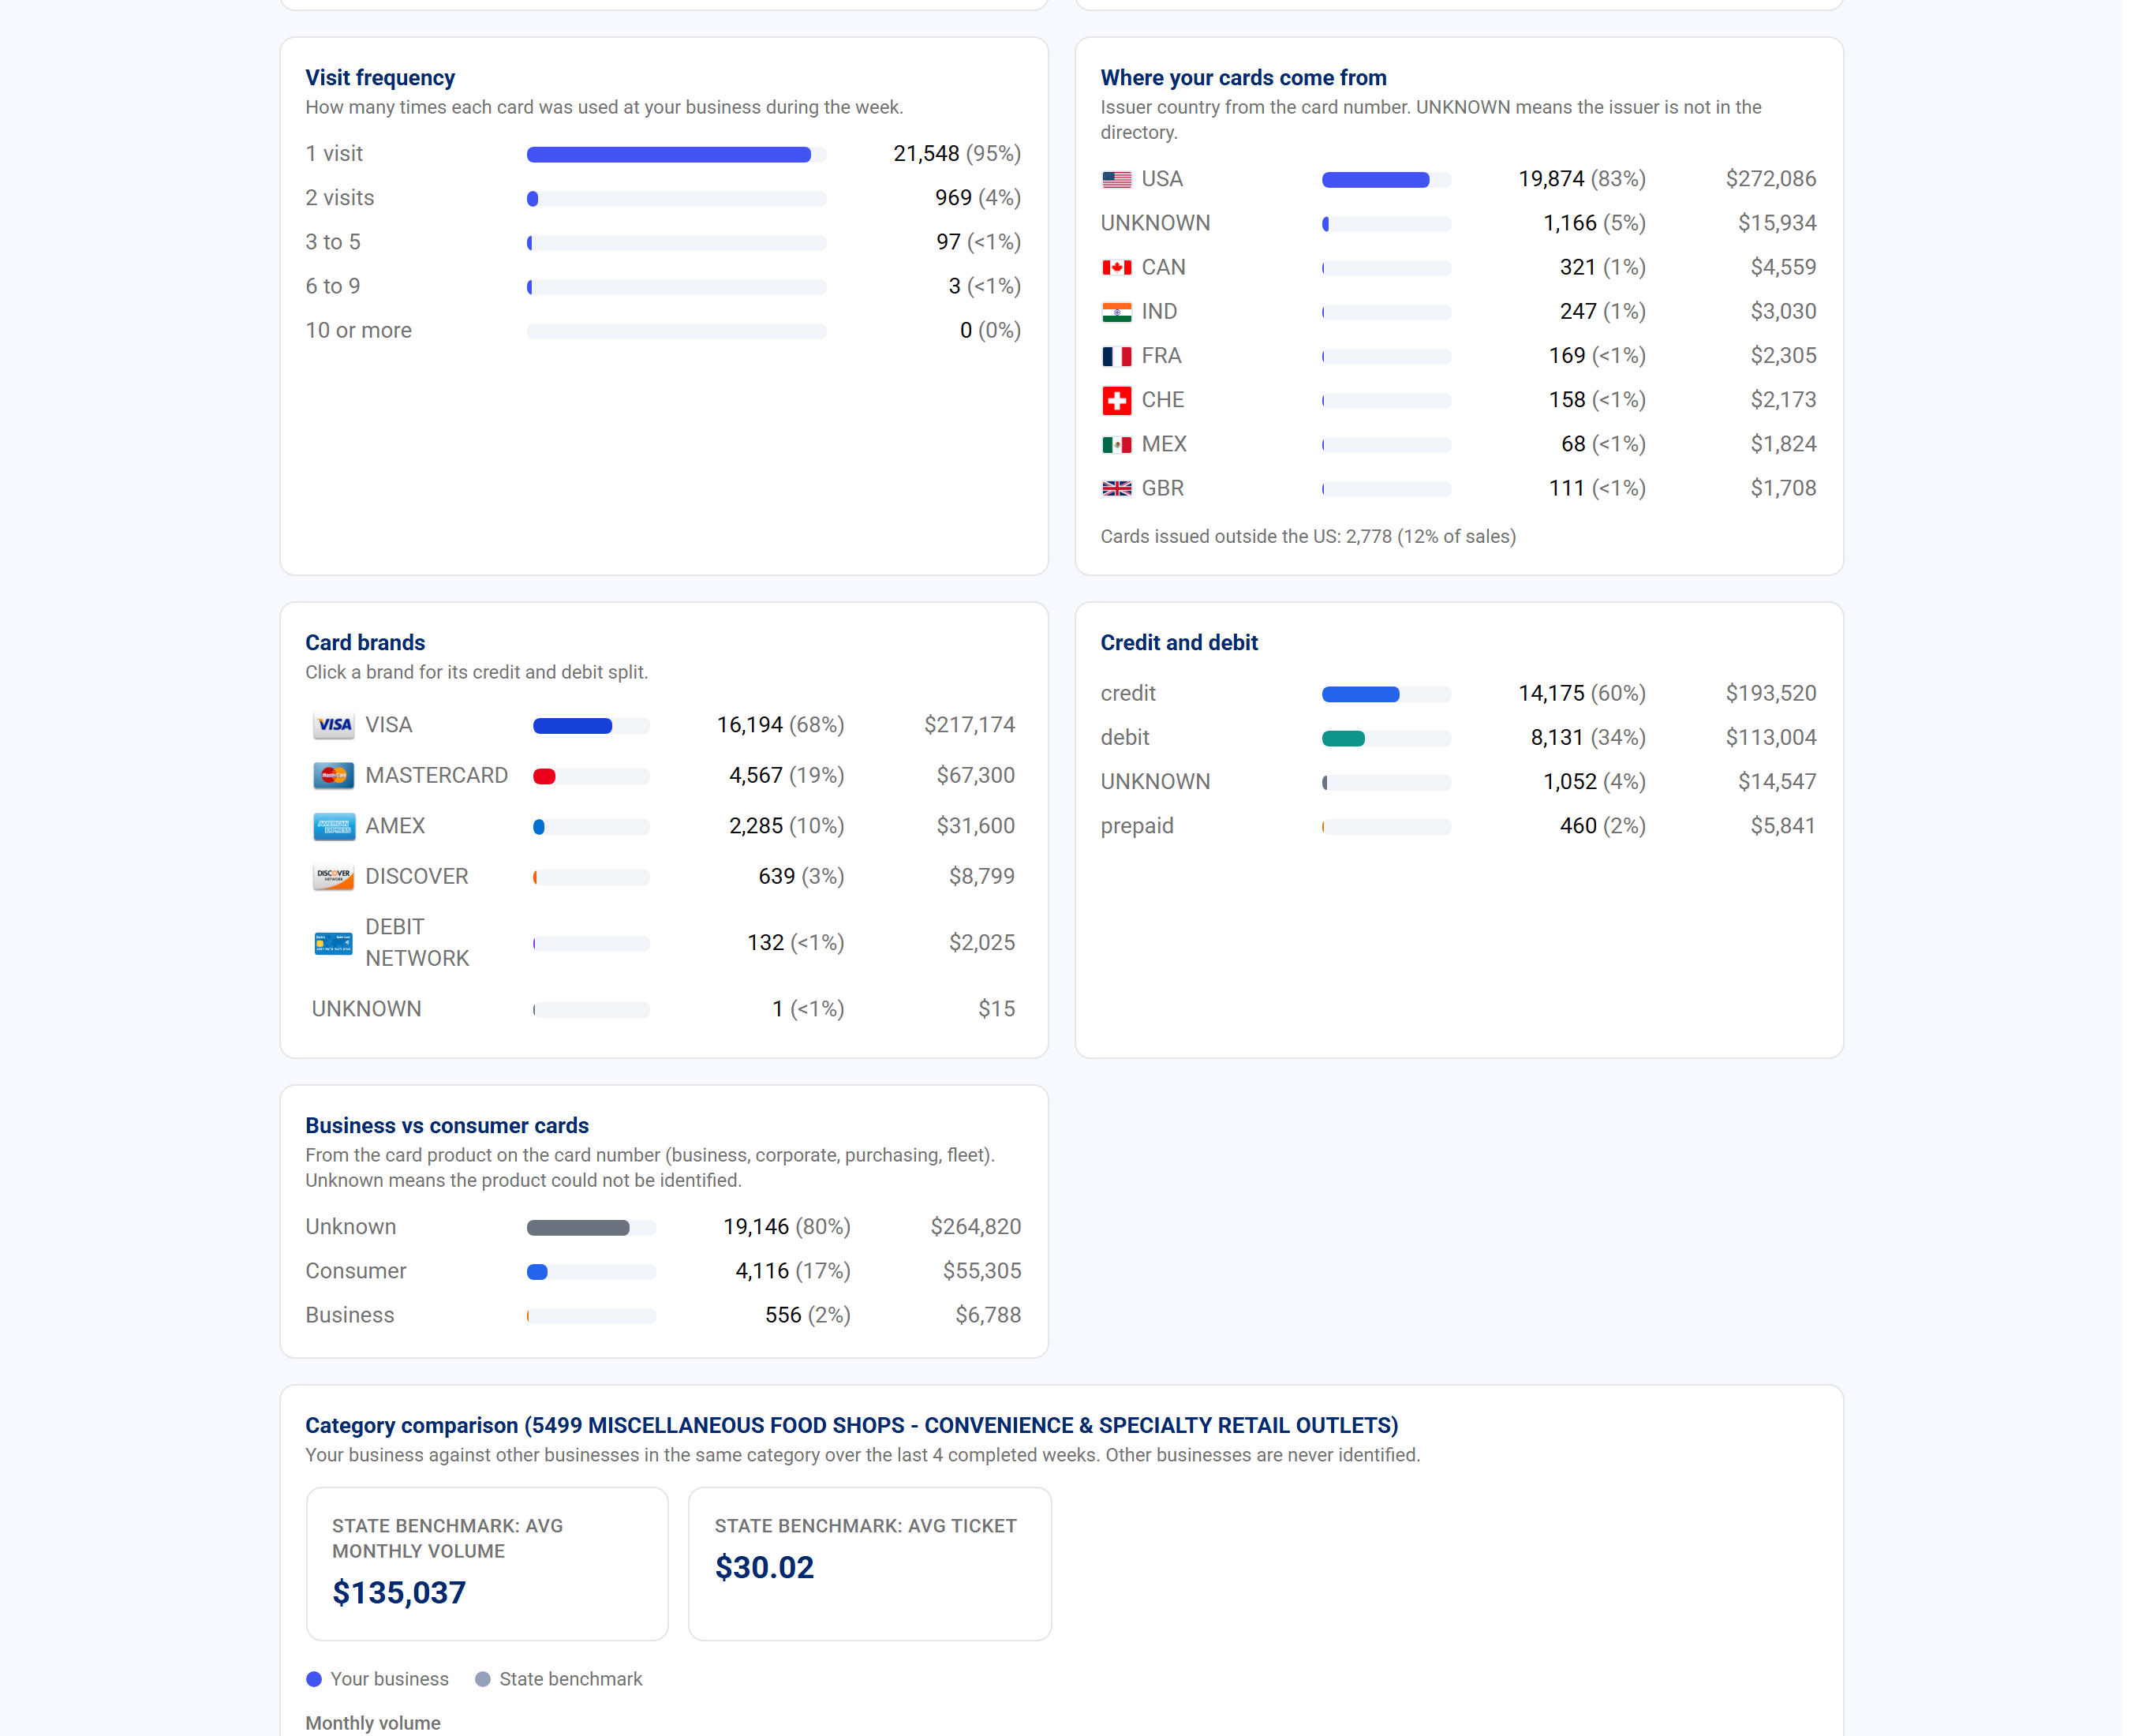
Visit frequency groups your returning cards by how often they come: once, a few times, or regularly over the period, so you can see whether you are building a base of repeat customers or mostly seeing one-time visitors.
Use it to judge a promotion. If a campaign brings new cards that do not return, the New count rises and the Returning count stays flat a month later.
A card counts as new the first time it is seen on your account. A customer who pays with a different card is counted as new again, so the New figure is an upper bound.
| On this screen | What it does |
|---|---|
| New / Returning | Counts of cards paying for the first time versus cards seen before, for the period. |
| New customers by week | Chart of first-time cards per week. |
| Visit frequency | Returning cards grouped by how many visits they made in the period. |
Where your cards come from
Each card carries the country of the bank that issued it and the brand and type of card. Paylytics uses this to show where your customers come from and what they pay with.
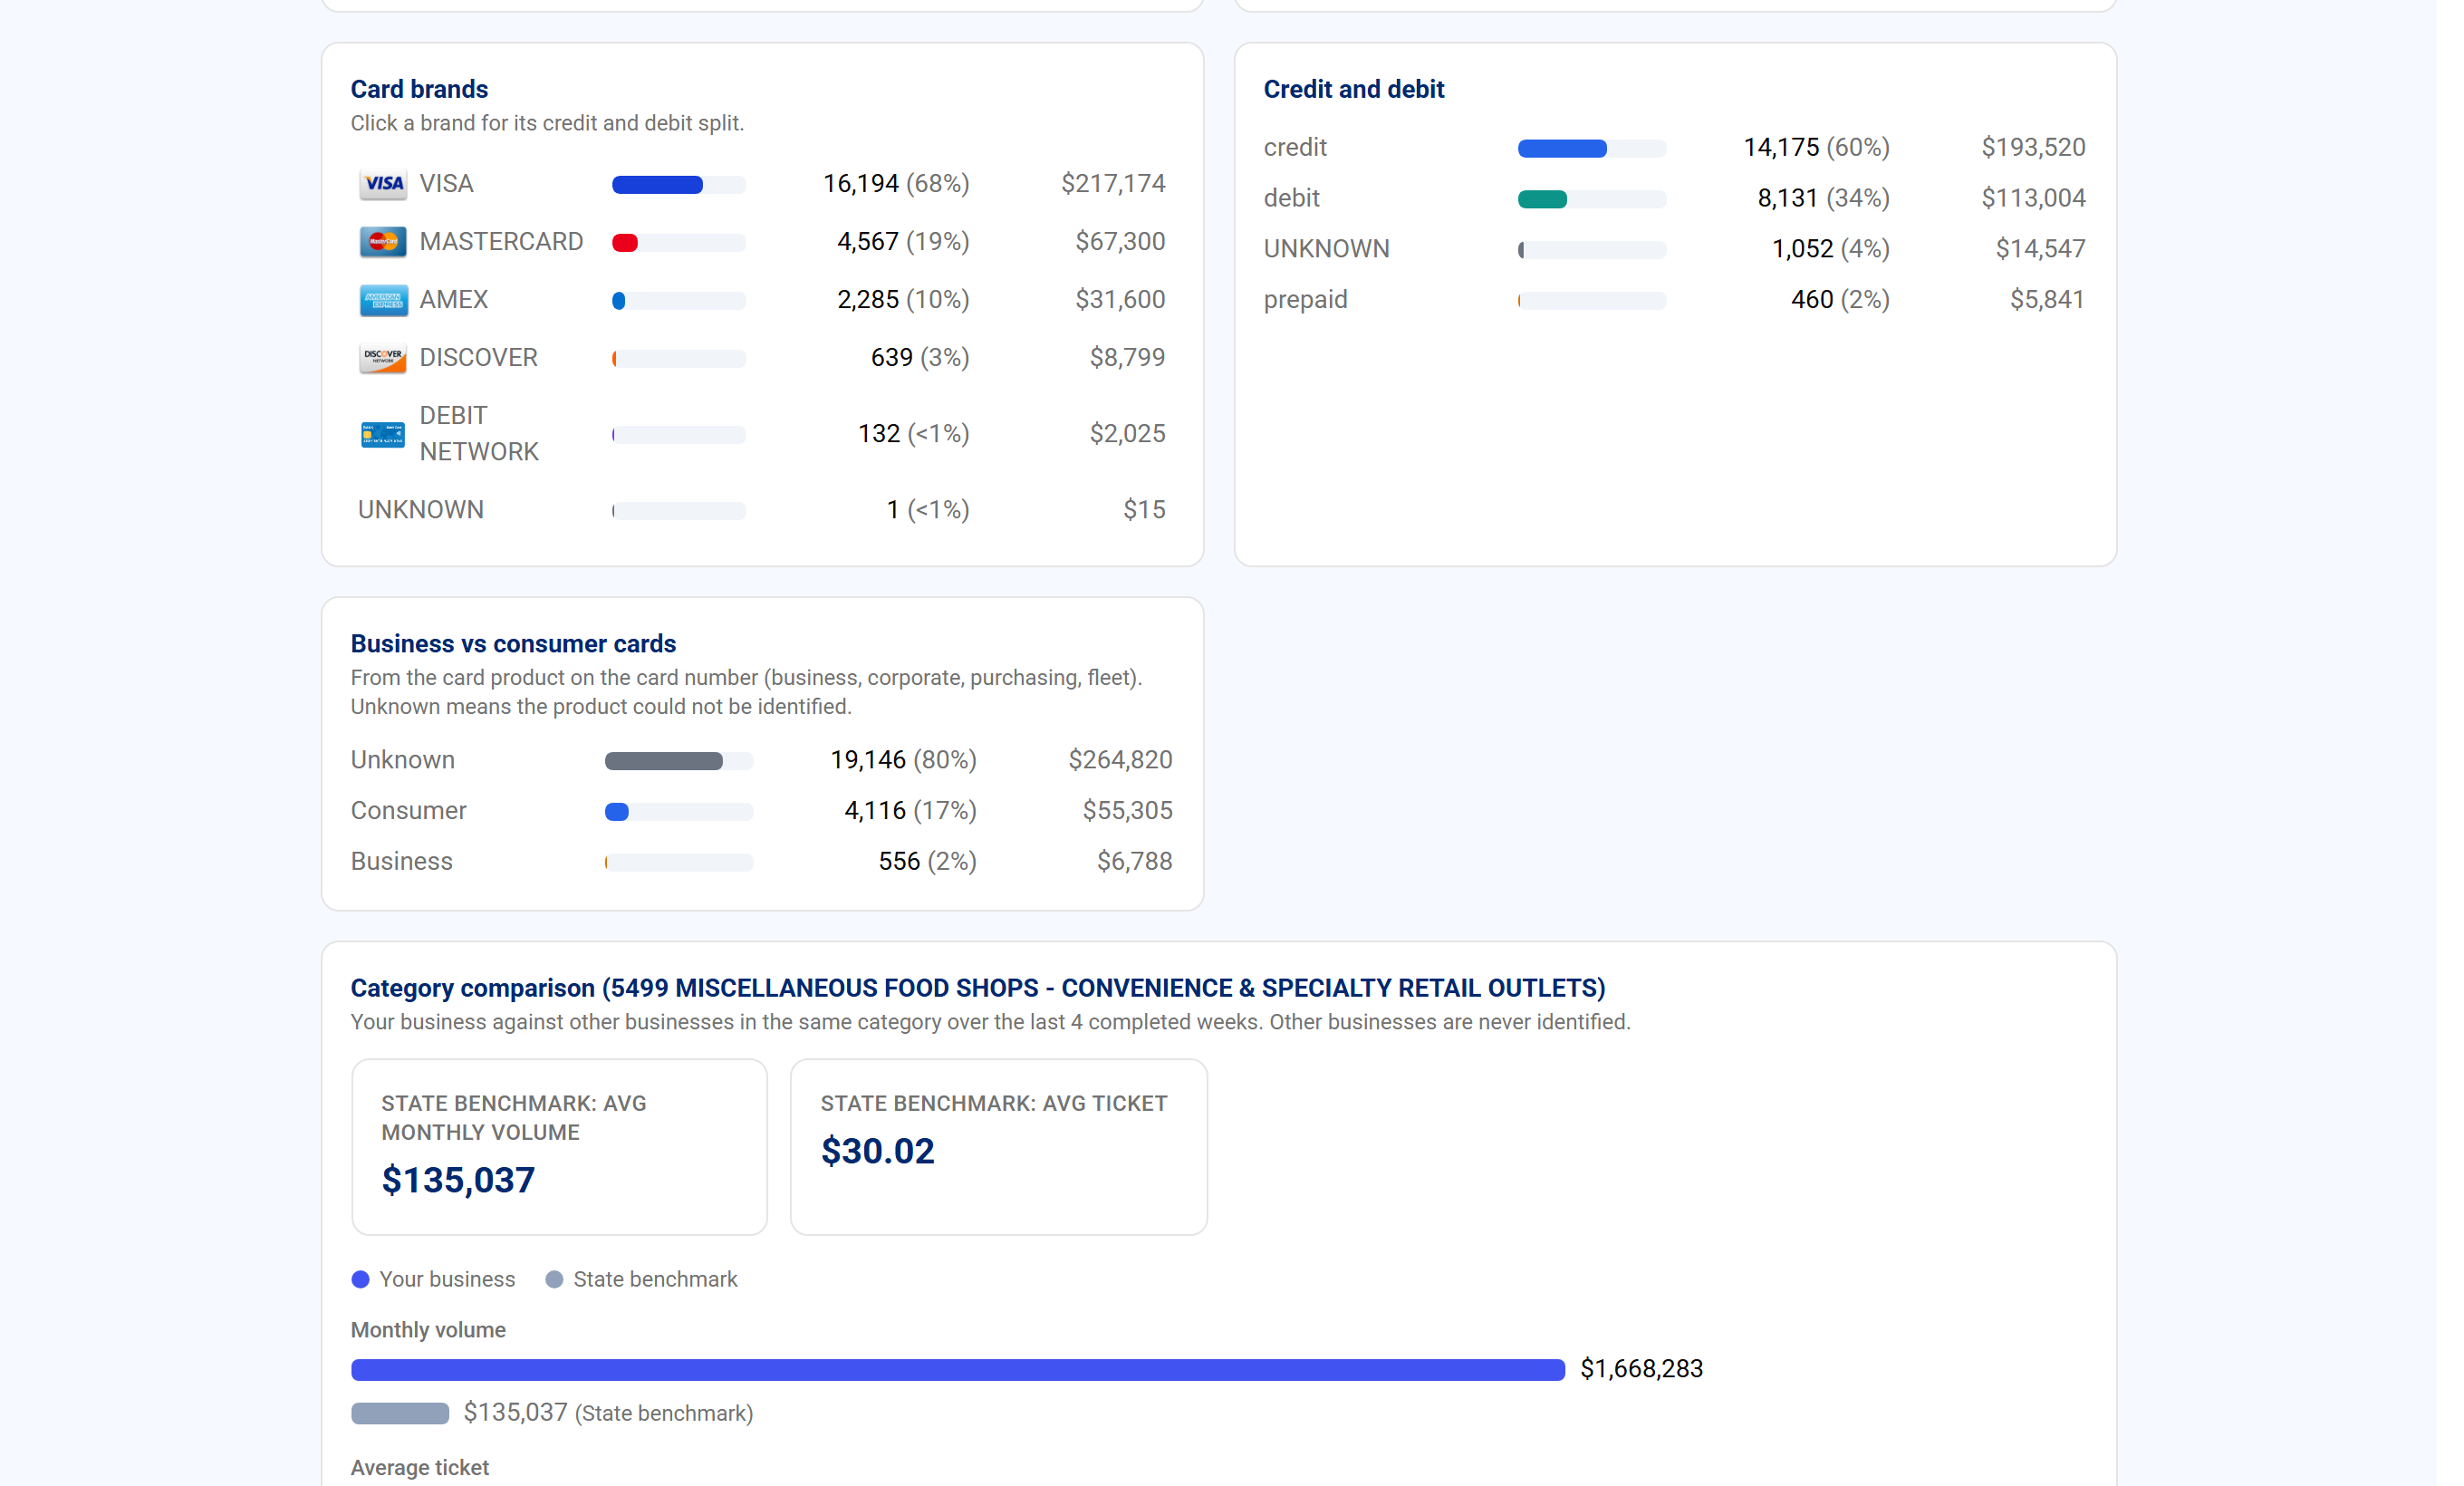
Where your cards come from maps the issuing countries. Cards issued outside the US lists the share and the top countries, which matters for tourist areas and for spotting unexpected foreign card activity on an online business.
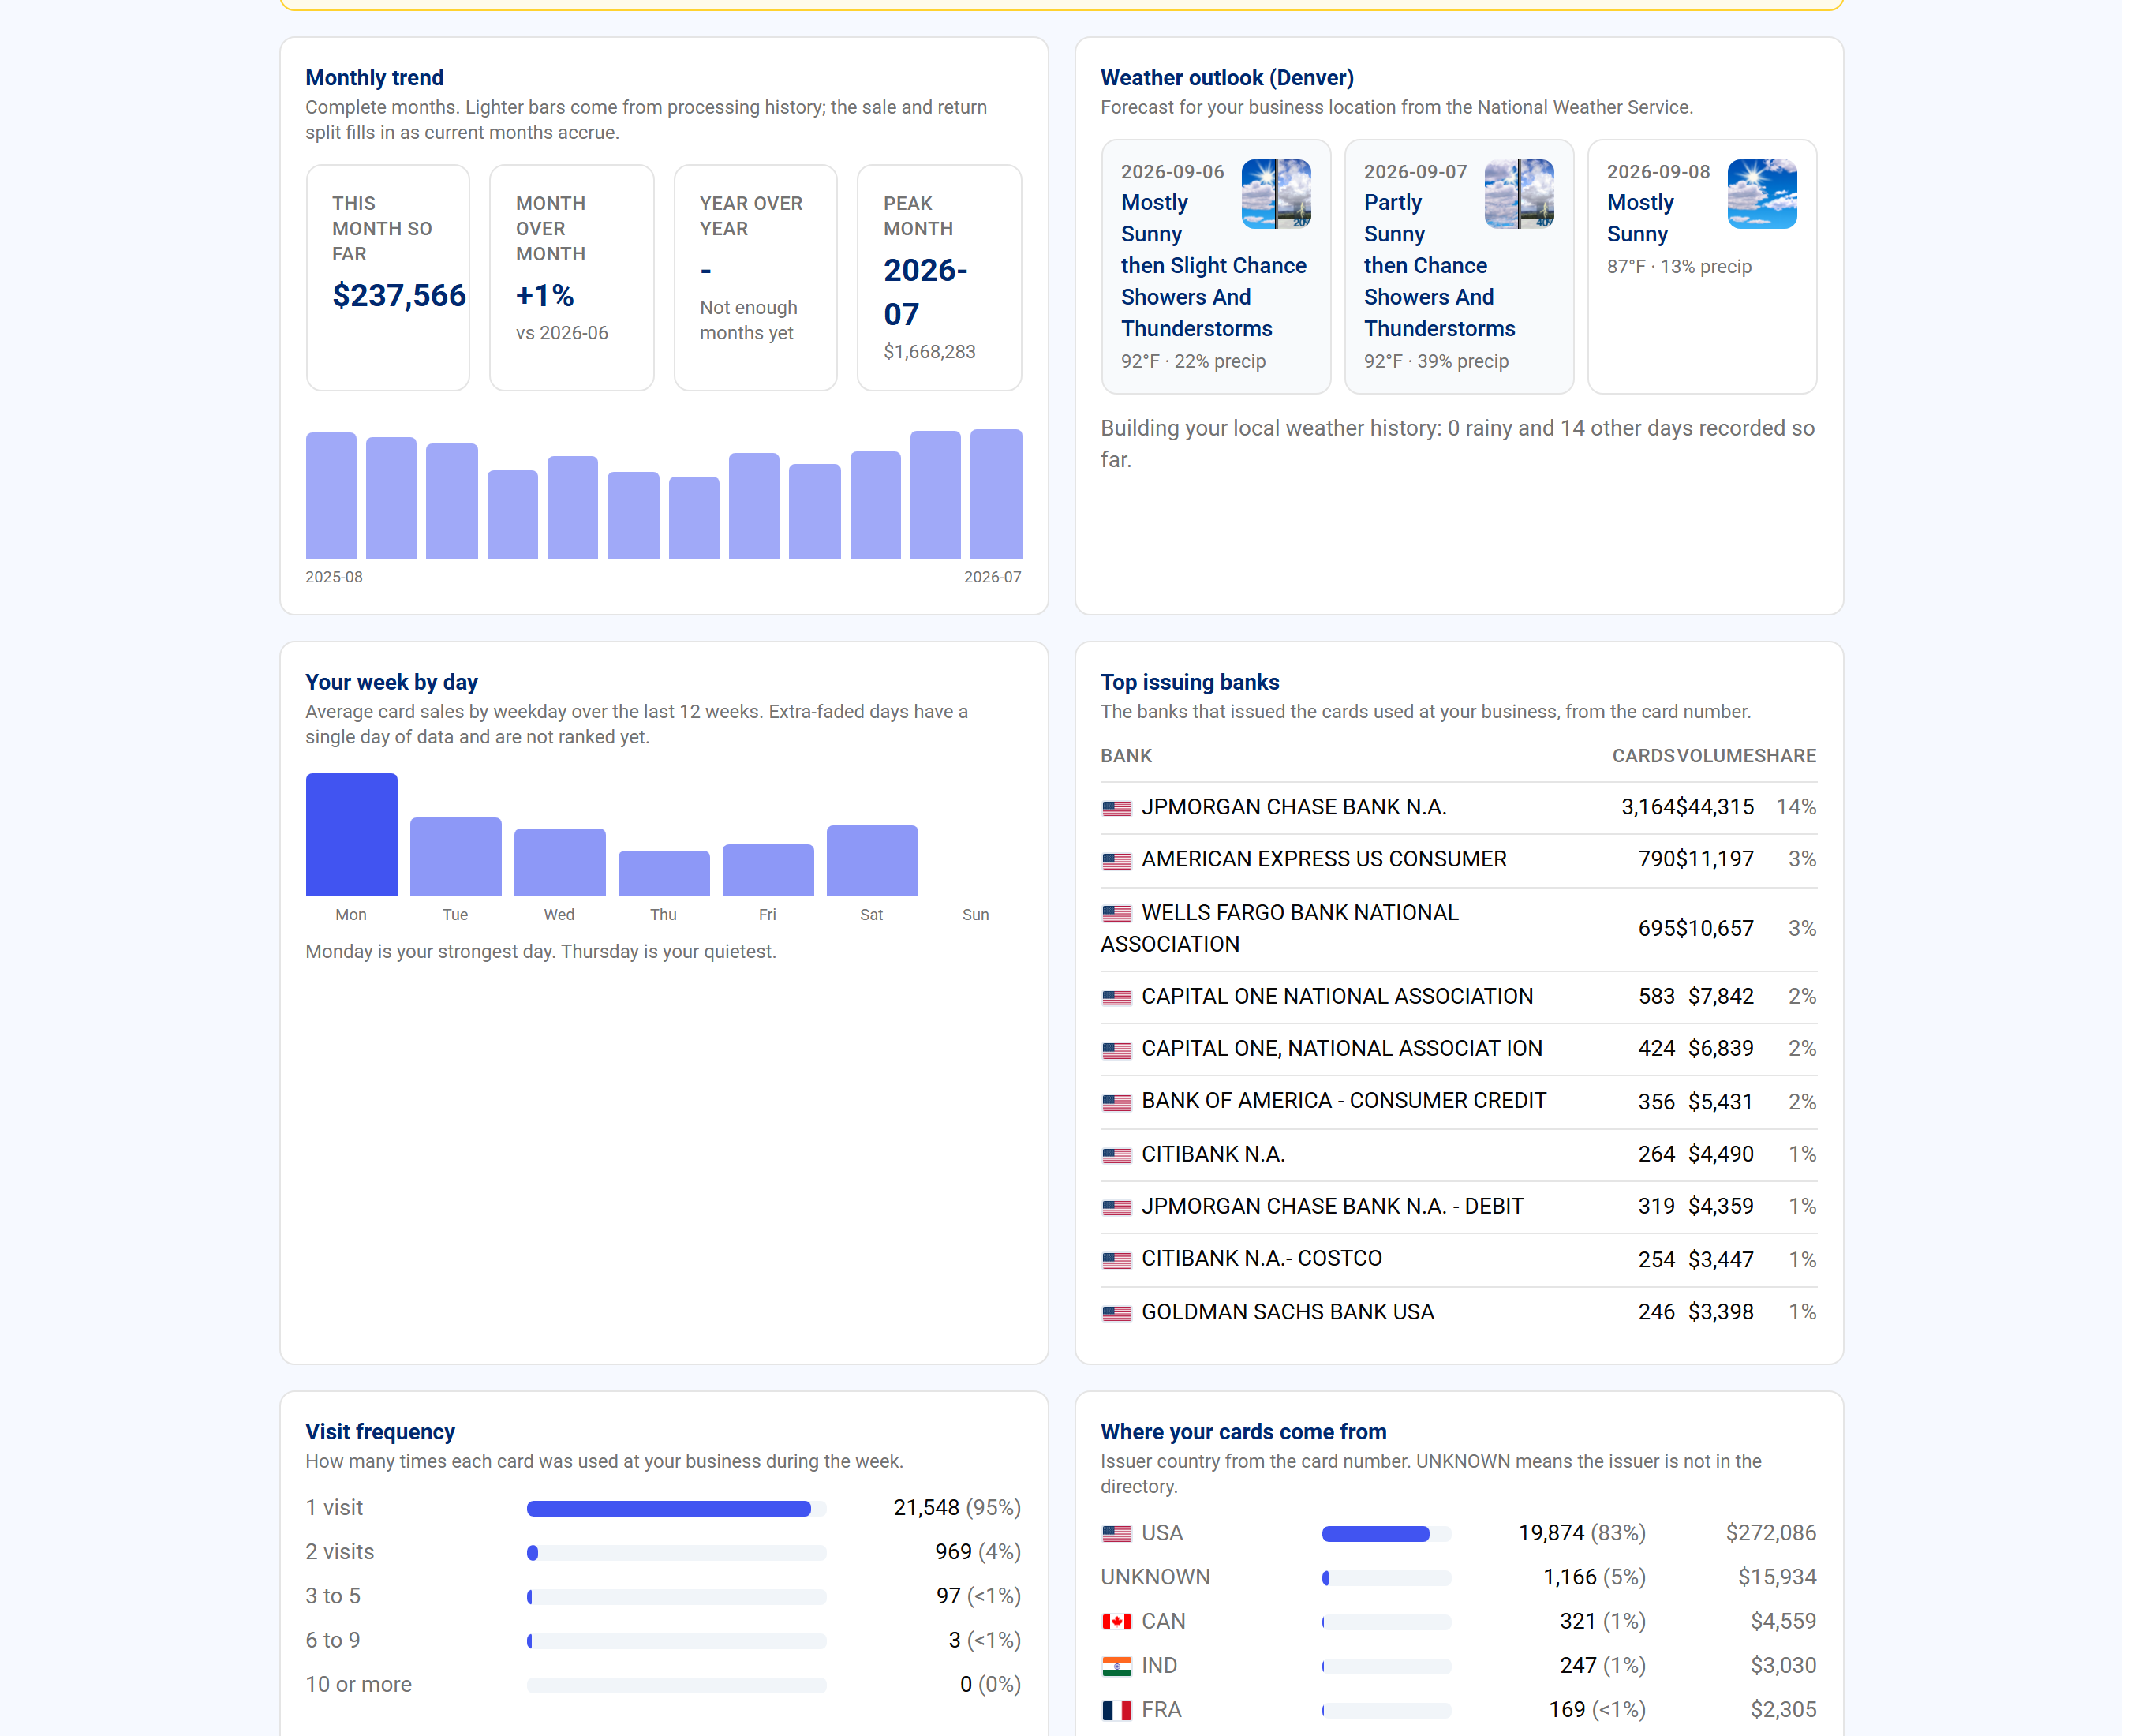
Card brands splits volume by brand. Credit and debit shows the mix, and Business vs consumer cards shows how much of your volume is on company cards. Top issuing banks lists the banks whose cards you see most.
Use the brand and type mix when you review your pricing and when you decide whether dual pricing or a debit-friendly option is worth offering. A high business-card share often means invoicing customers who could pay by bank instead.
| On this screen | What it does |
|---|---|
| Where your cards come from | Map and list of issuing countries by share of cards. |
| Cards issued outside the US | Share of foreign cards and the top countries. |
| Card brands | Volume by card brand. |
| Credit and debit | Share of volume on credit versus debit cards. |
| Business vs consumer cards | Share of volume on company cards versus personal cards. |
| Top issuing banks | The banks whose cards you see most often. |
Category comparison
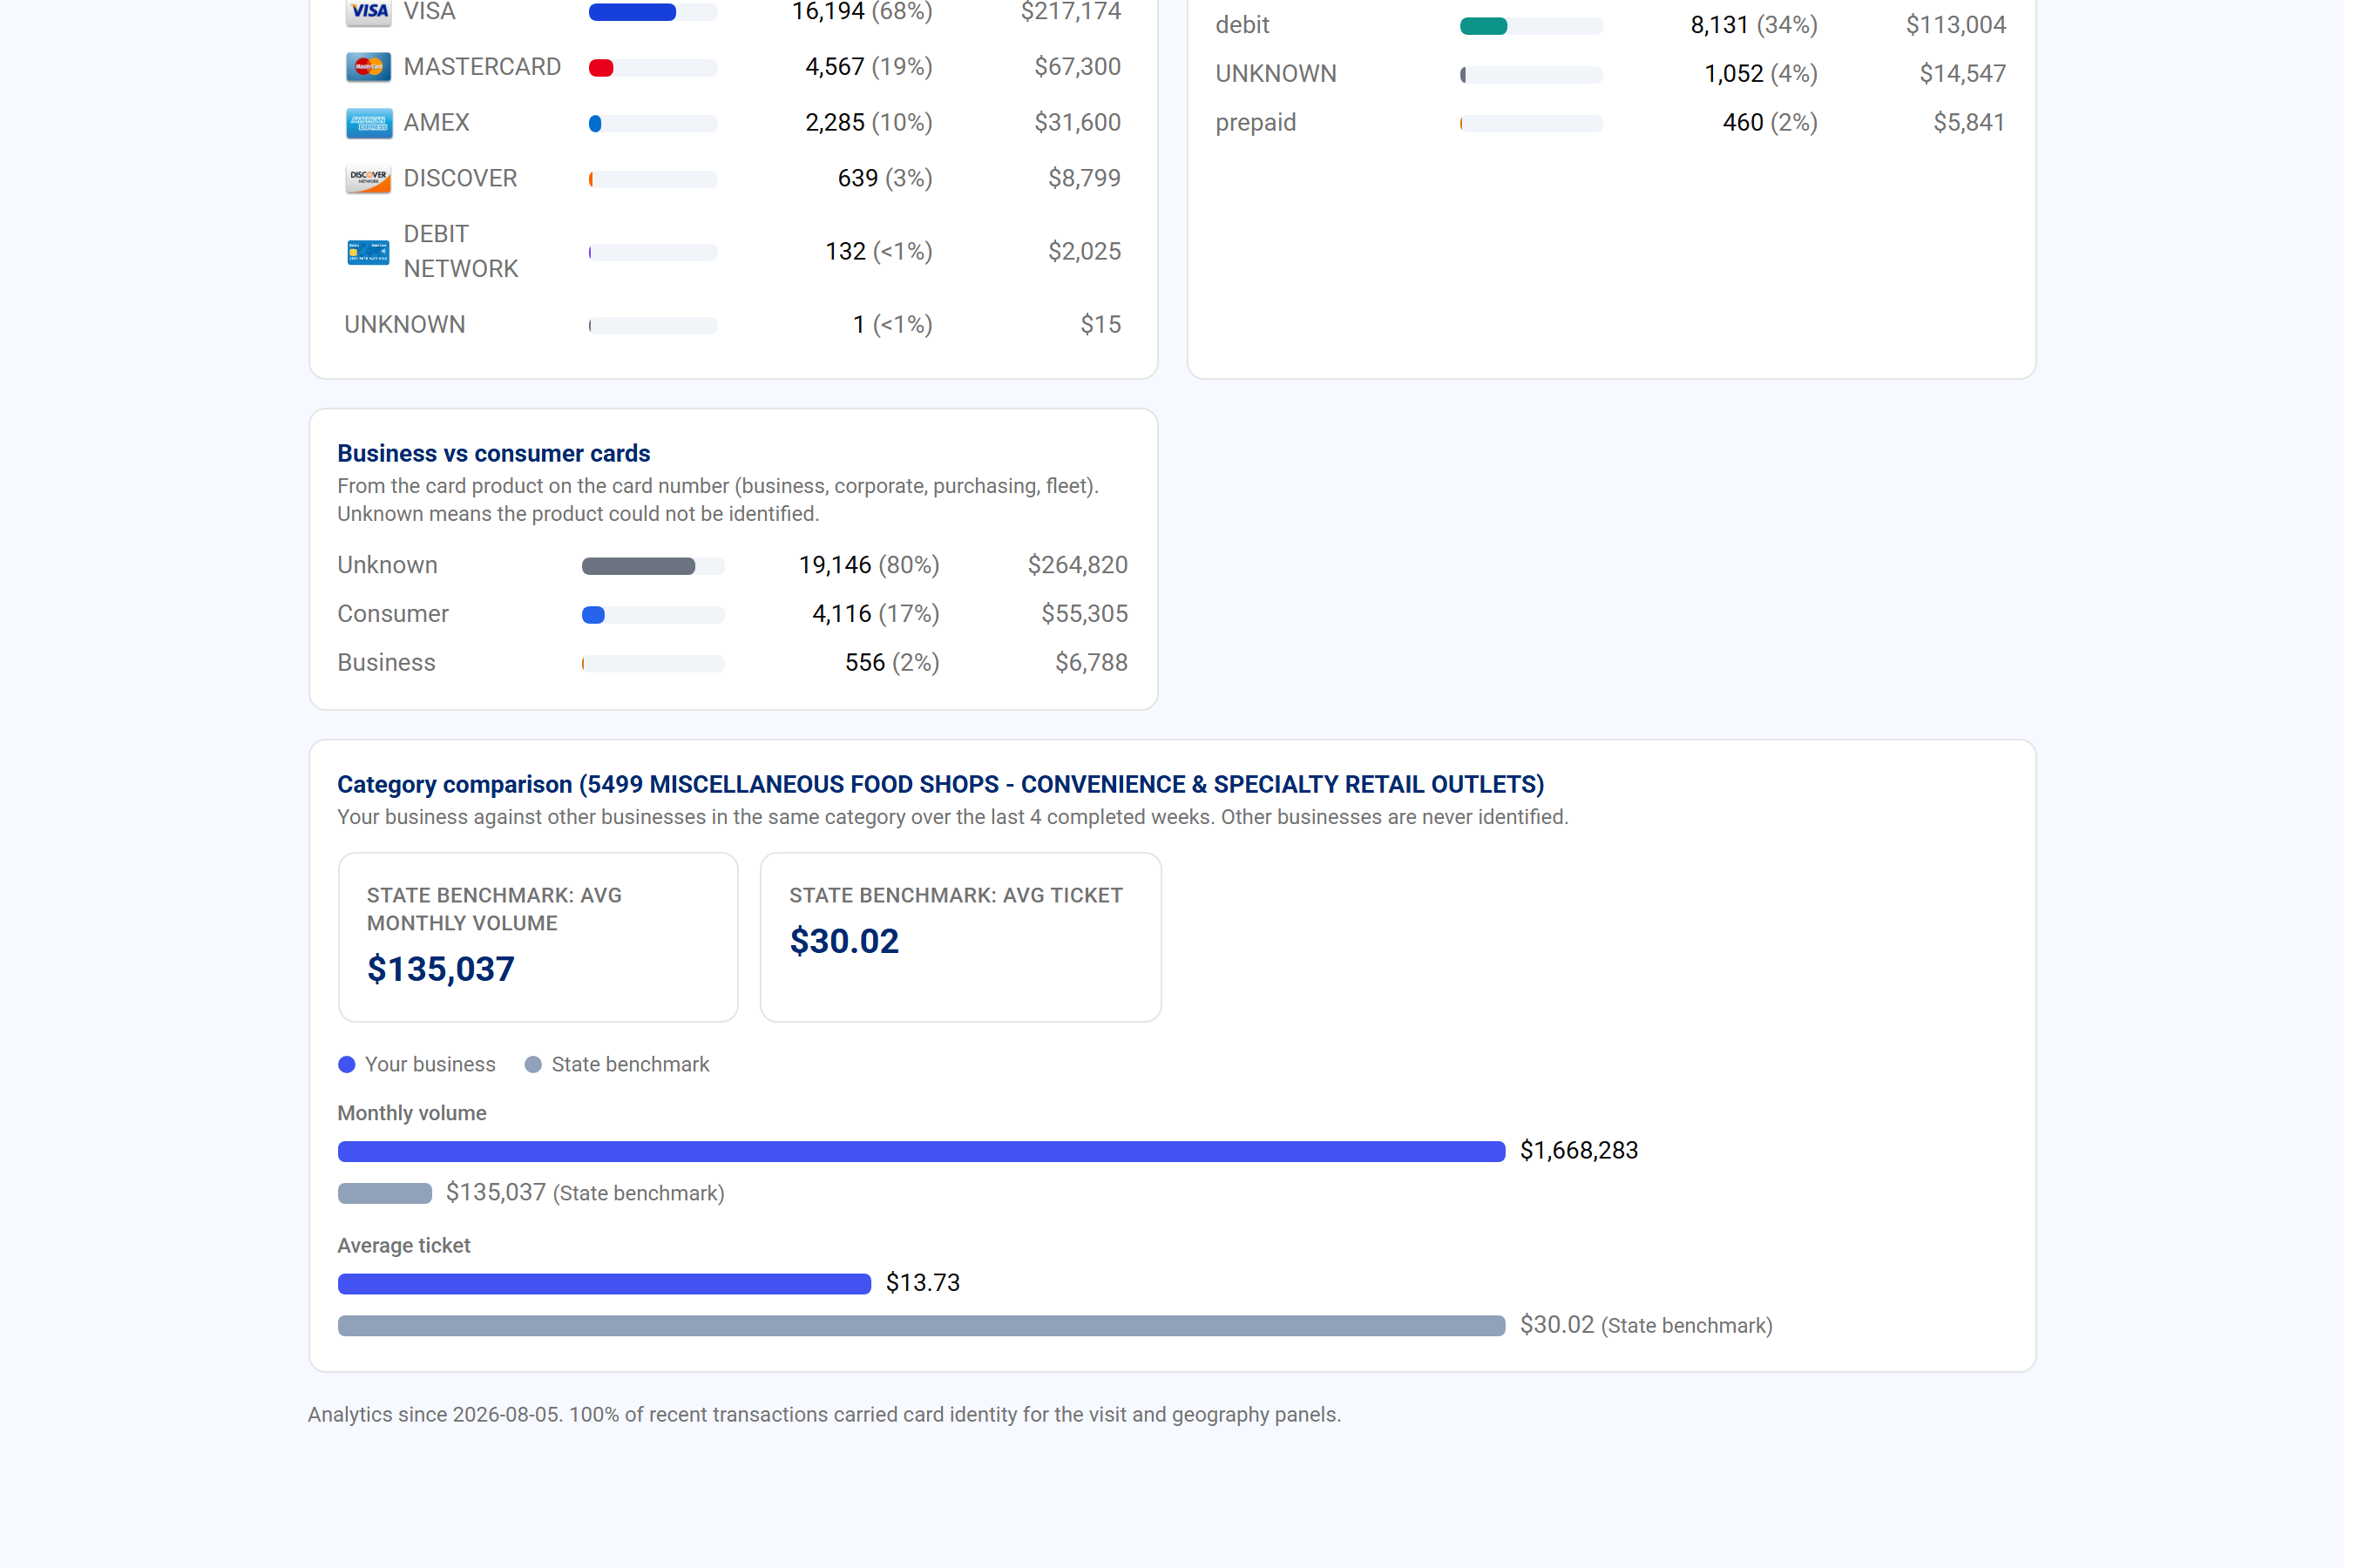
Category comparison puts your numbers next to other merchants in your business category on the Merchant360 platform. It shows the median and the percentile bands for average ticket, transactions per week, and card volume, and marks where you fall.
State benchmark narrows the comparison to merchants in your state, so a bakery in Texas is compared with Texas bakeries rather than the whole country.
Use it to spot where you differ. An average ticket well below your peers may mean an upsell opportunity; transactions well above may mean you are busier than the category and can raise prices.
Comparisons are anonymous. The Peers count next to the median tells you how many merchants are in the group. If the card is empty, your category or state does not yet have peers on the platform.
| On this screen | What it does |
|---|---|
| Category comparison | Your average ticket, weekly transactions, and volume against the category median with percentile bands. |
| Peers | The number of merchants in the comparison group. |
| Percentiles | Where your figure sits within the category, for example top quarter. |
| State benchmark | The same comparison limited to merchants in your state. |
Weather, months, and your week by day
Three cards help you plan the week. Weather outlook shows the forecast for your business address from the National Weather Service, and once enough rainy and dry days have been seen it reports how much your sales change on rainy days. Your week by day shows average volume and transactions for each weekday over recent months, so you know which days carry the week. Monthly trend charts month by month with month-over-month and year-over-year changes and marks your peak month.
Use the week-by-day card to set staffing and ordering. Use the weather card the same way when the forecast is unusual. Use the monthly trend to compare a month with the same month last year rather than with last month, which removes seasonality.
If the weather card is empty, the business address on your account could not be matched to a forecast area. Check the address under Account.
| On this screen | What it does |
|---|---|
| Weather outlook | The forecast for your address, with the measured change in your sales on rainy days once enough days have been collected. |
| Your week by day | Average volume and transactions for each day of the week over recent months. |
| Monthly trend | Volume by month with MoM and YoY changes and the Peak month marked. |
Regulars and goals
Regulars are cards that have paid you five or more times in the last thirty-five days. The card shows how many regulars you have, the cards seen most often, and Avg days between visits, so you can see how quickly your best customers come back. No customer identities are used, just the card.
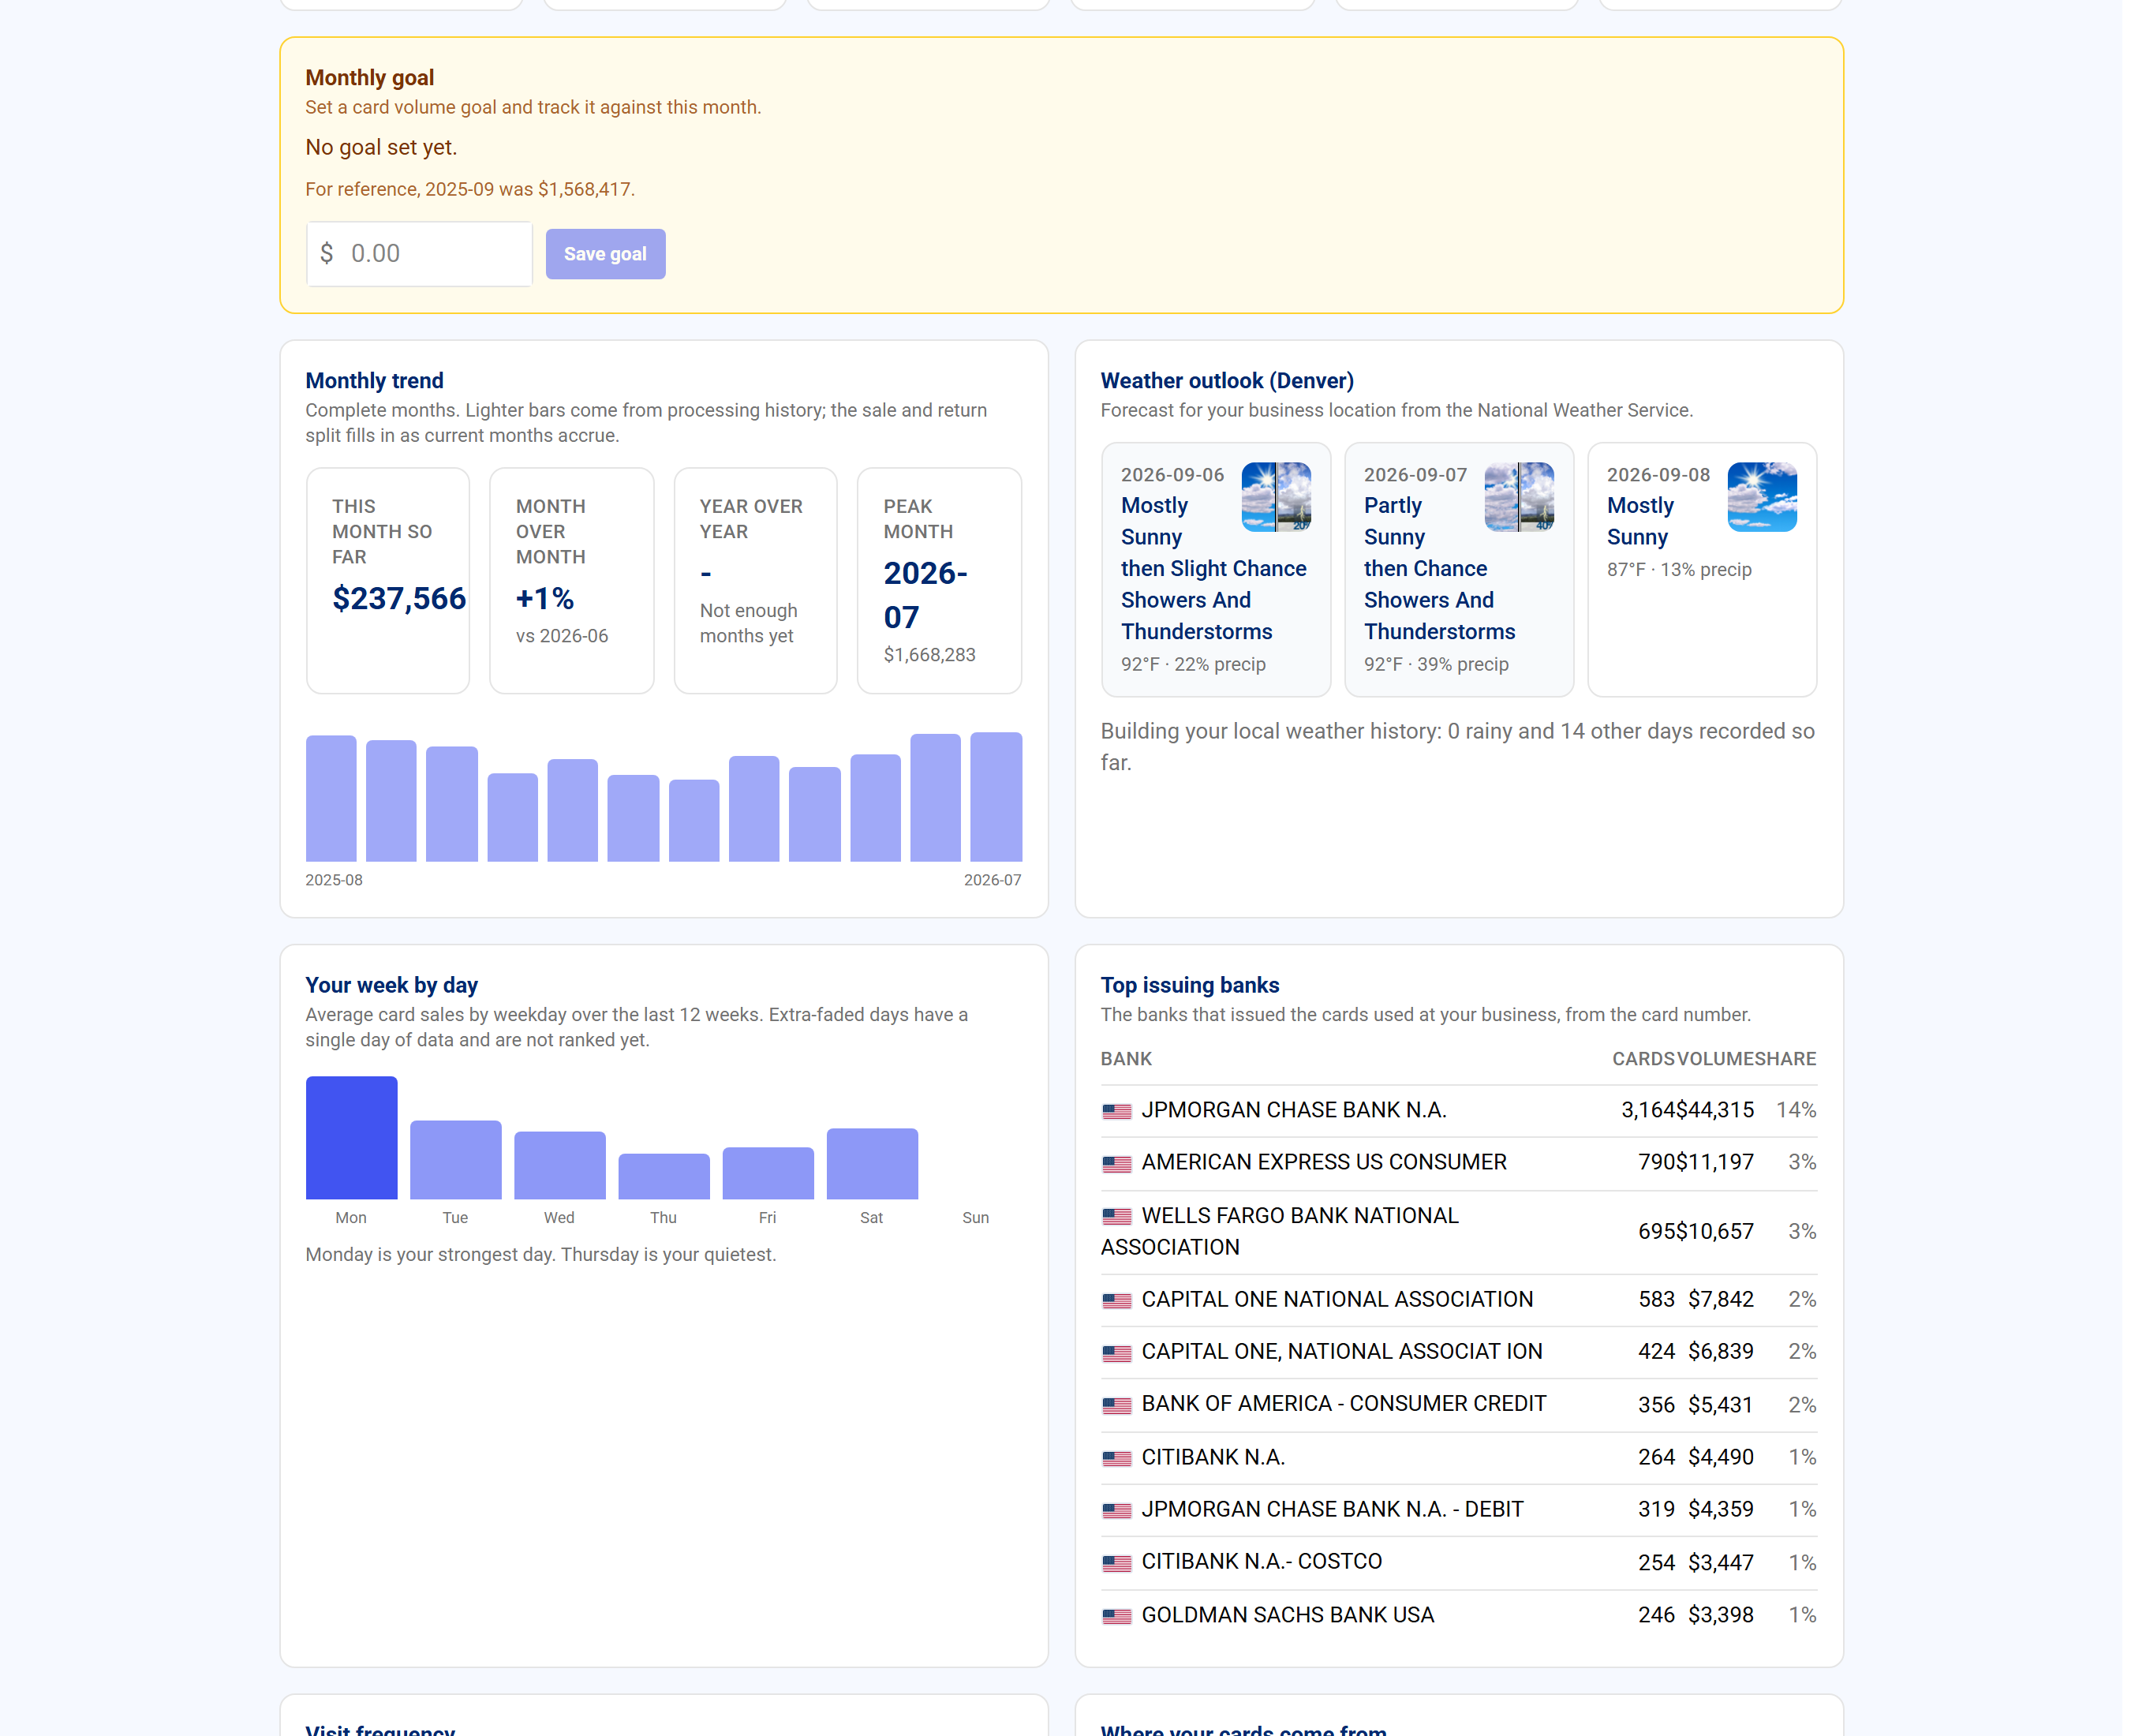
Monthly goal lets you set a card-volume target for the month. Enter the dollar amount and click Save goal. The card then shows where you are against the goal and whether you are on pace, using the days left in the month and your recent daily average.
Set the goal at the start of each month, and use the pacing line during the month to decide whether a promotion or extra hours are needed. The goal is saved on the account and recorded in the account history.
If the Regulars count is zero, no card has reached five visits in the window; this is normal for businesses with occasional customers. If the goal pacing looks wrong early in the month, it is projecting from only a few days and settles as the month goes on.
| On this screen | What it does |
|---|---|
| Regulars (5+ visits, last 35 days) | Count of cards with five or more visits in the last thirty-five days, with the most frequent cards listed by last four. |
| Avg days between visits | The average gap between visits for returning cards. |
| Monthly goal | Dollar field for your card-volume target. Save goal stores it. |
| Goal pacing | Progress against the goal with an on-pace or behind indicator based on days left in the month. |
Privacy
Paylytics never stores or shows a card number. To recognise a returning card it keeps a one-way code derived from the card, which cannot be turned back into the number. Names, emails, and addresses are not used at all.
Category and state comparisons are built from totals across many merchants. No other merchant can see your numbers, and you cannot see theirs; only the aggregate median and percentiles are shown, and only when the group is large enough.
Weather data is fetched for your business address only and is not linked to any customer.
If you have a question about how your data is used in the comparison, ask your account manager.
| On this screen | What it does |
|---|---|
| One-way card code | How returning cards are recognised without storing the card number. |
| Aggregate comparison | Category and state figures are medians and percentiles across many merchants, never individual data. |